How to Understand the level of cost (moving average) for each holding of ETF-QQQ?
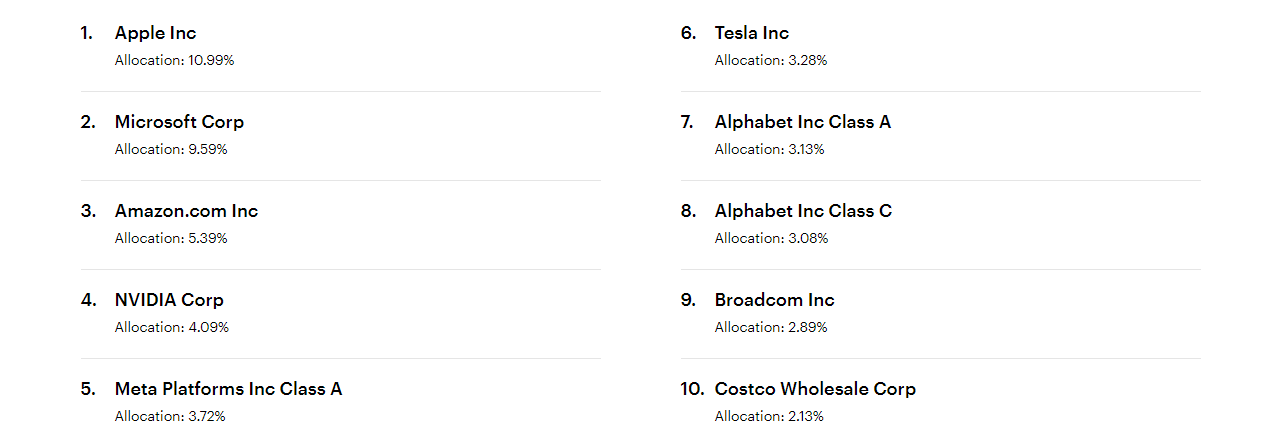
In the previous article, How to Create X-days Moving Average Chart in stock market, we learned how to calculate moving average to reflect the average cost during the defined timeframe. In the article of How to Calculate PE ratio for ETFs via Python in Colab — QQQ, we know how to capture the holdings of a ETF. Today, we are going to combine these two to create a tool to understand where the cost is landed for each holding of QQQ.
Invesco QQQ ETF tracks the Nasdaq-100 Index — giving you access to the performance of the 100 largest non-financial companies listed on the Nasdaq. The fund and the index are rebalanced quarterly and reconstituted annually.
Step 0: Import all required packages.
import pandas as pd
import yfinance as yf
import numpy as np
from datetime import date
import time
Keep reading with a 7-day free trial
Subscribe to Informula to keep reading this post and get 7 days of free access to the full post archives.


